Spreadsheets are ubiquitous and practical. Many academic and professional courses use them as a pedagogical aid. Applications abound in finance, accounting, economics, business, and even science and computing. I am myself a software engineering professor. Although my other courses at Carnegie Mellon University rely heavily on coding skills, I also teach an interdisciplinary graduate course, Decision Analysis and Engineering Economics for Software Engineers, which takes advantage of spreadsheets extensively.
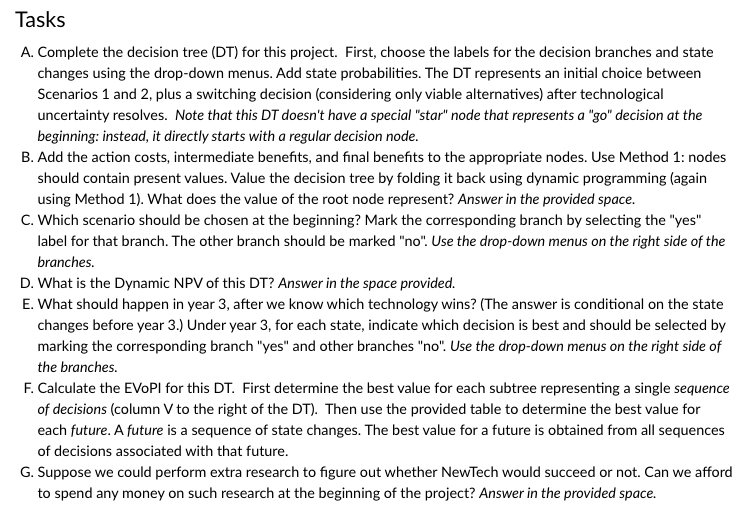
Many of my assignments and labs in this course are deployed in the form of a spreadsheet. The students receive a problem description and an Excel template that serves as a starter spreadsheet. They complete the template according to the given problem description, and submit it as their solution. The submitted Excel file is then graded according to specified rubrics, and the students get a score and some feedback about the correctness and quality of their solution. To give you an idea, below is a typical assignment description in this course. The assignment presents a case study concerning a software development project, which needs to be analyzed and valued using the information and data provided. Students complete the specified tasks to solve the case study.
The gist

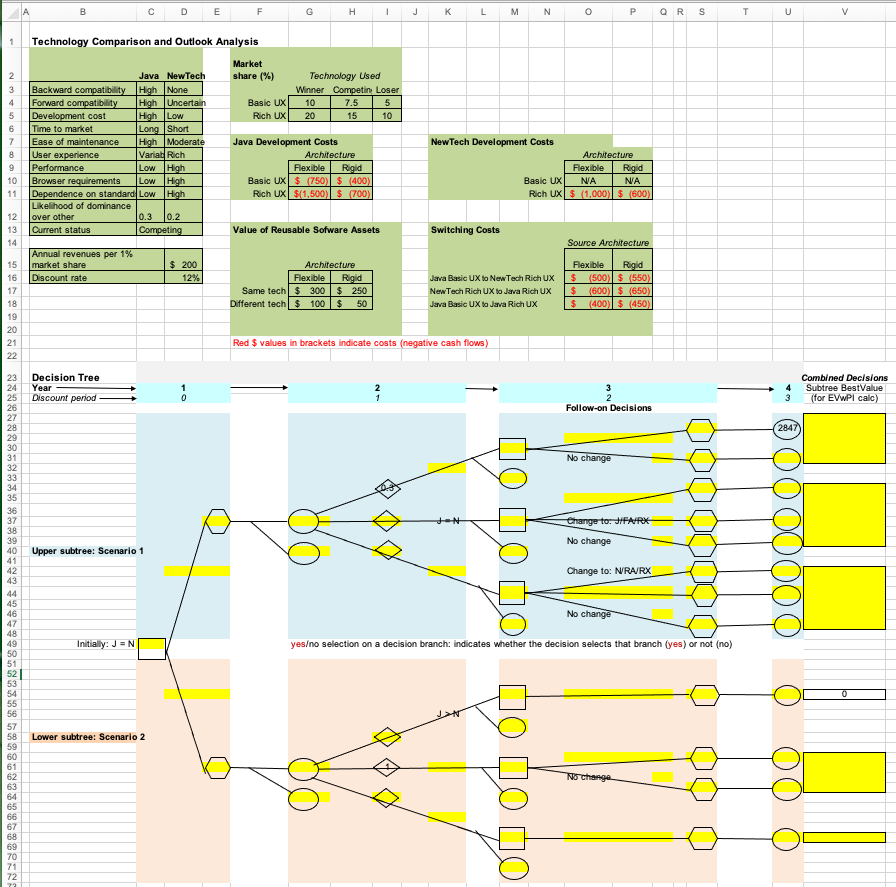
Together with the problem description, the students are provided with a starter Excel template, which includes further details and some data. They work on the template to solve the problem given to them by completing the yellow highlighted cells.
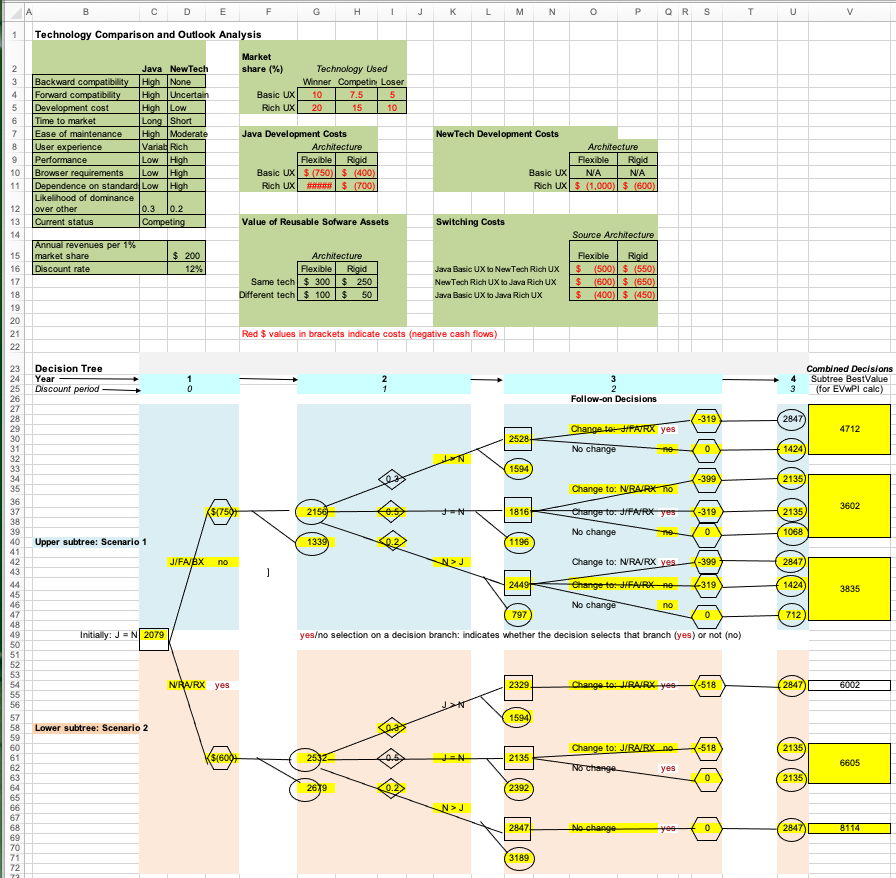
At the end of this process, here is what a student may submit as the completed solution:
Infinitely many correct solutions and cascading cell dependencies get in the way of grading spreadsheets
Grading the submitted solution seems straightforward at first: one could simply compare the evaluated values of the highlighted cells in the student submission with those of a reference solution contained in a key spreadsheet file. However the process is not that simple in practice: in a spreadsheet, many cells contain formulas that refer to other cells, which may further refer to other cells. If a student makes a mistake in a cell that is at the bottom of a dependency chain, the mistake will be propagated to all the other cells that depend on it. With this naive approach, the student’s solution will end up being penalized multiple times for the same early mistake. To prevent multiple penalties, the grader may need to compare a formula in the student’s solution to the correct formula in the key file. If the two formulas are mathematically equivalent, the student should not be penalized for an earlier mistake, and given the full credit for that cell. Therefore, when grading the solution, graders must be careful and flexible. Because there are an infinite number of ways a correct solution can be expressed as a formula and cell dependencies tend to go deep, grading spreadsheet assignments manually can be quite tedious, laborious, and error-prone, even for simple assignments. The effort required for the mechanistic parts of this process is best allocated to more meaningful and pedagogically more value-adding activities. Fortunately, automation comes to the rescue.
Automated grading with PySheetGrader
I have been a fan of automated grading for many years. Automated grading of programming-based assignments is now widespread in computer science and software engineering education. Several platforms and tools exist. Low-stakes assignments and labs in another course I teach on software verification and testing—a programming- and modeling-intensive course—are nearly fully automated, which saves my teaching assistants and me precious time that we can allocate to more open-ended and more cognitively demanding aspects of the course. I wanted to reap similar benefits in my decision analysis course that uses spreadsheet assignments, but I could not find any tool or system on which I could build to automate the grading process. Building on previous successes, finally my students and I created PySheetGrader, a tool for fast and flexible grading of spreadsheet assignments.
PySheetGrader supports many types of cell-based grading strategies for maximum flexibility and expressiveness. We have integrated PySheetGrader into Vocareum, a cloud-based lab platform for computing education, and used it with great success in my course. Going further, push-button integration of Vocareum with my university’s LMS system, Canvas, allowed a more seamless experience for my students. In the rest of the blog, I will explain the philosophy, architecture and main features of PySheetGrader.
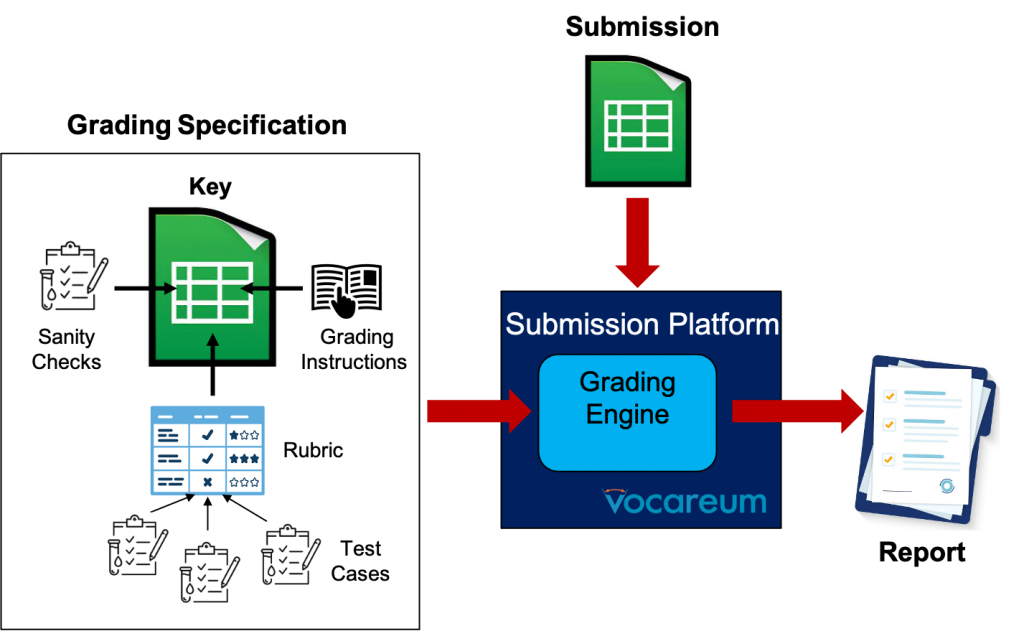
PySheetGrader has a simple architecture, shown below. The central concept is the grading specification, which is embedded directly into a key spreadsheet file representing a reference solution. The key file is just an ordinary Excel file (with .xlsx extension): it contains a fully-developed solution for the assignment, together with meta-information that specifies how the assignment will be graded. This information includes grading instructions, cell-based rubrics, sanity checks, and cell-based test cases. When a student submits a solution to the submission platform (Vocareum in our case), PySheetGrader’s grading engine processes the student submission using the key file to produce a grade report. The report contains granular and structured feedback to the student, and tallies up the rubric components to assign a total score to the student’s submission. The student can then revise the solution based on the feedback, and resubmit if necessary.
Next, I will discuss the core features of PySheetGrader with several examples. The core features provide us with a wide range of ways we can create auto-graded assignments, but they have limitations. PySheetGrader’s expressiveness can be improved substantially with advanced grading strategies and concepts, such as sanity checks and assertions. I will save the discussion of these advanced strategies for a future blog.
A simple example with basic cell-based rubrics
To illustrate how PySheetGrader works, we’ll start with a simple example with two simple rubric types. The assignment is about calculating the total amount for a grocery store transaction from unit prices of items, quantities purchased, and a sales tax rate. The students are given this Excel starter template to complete the assignment:
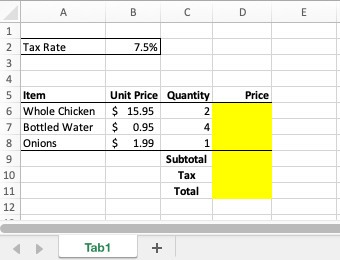
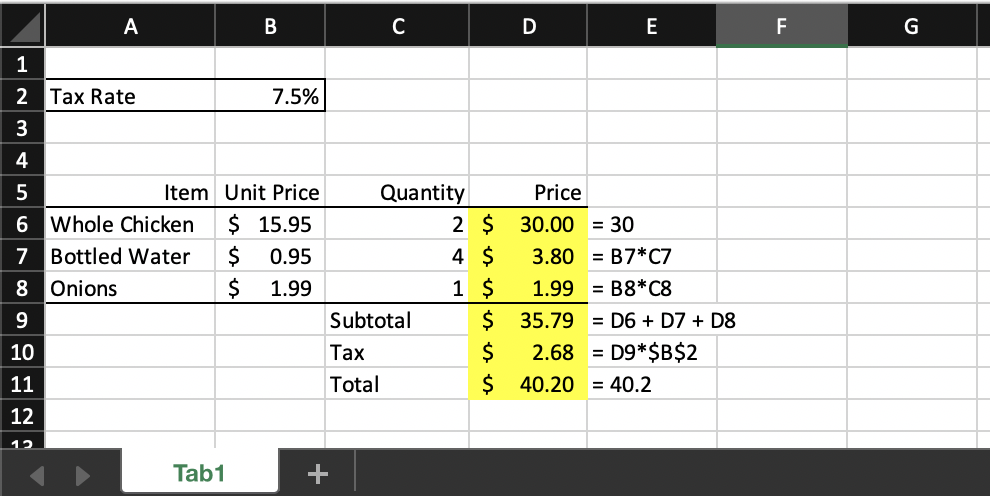
The highlighted cells need to be filled out in the submitted solution. In a key file that mirrors the template the students receive, the instructor works out the solution and specifies rubrics in a domain-specific language for grading. Rubrics are attached as Excel notes to selected highlighted cells. Suppose the instructor decides that cells D6, D8, D9, D10, and D11 will be graded. Note that the highlighted cells D6 to D8 are computed in a similar manner, so the instructor decides to sample only two of these three similarly-computed cells. If this sample is completed correctly by the student, we will assume that the cells in the same column that should use the same formula are too. (In general, we don’t need to grade every single row of a computed column in a data table if the table’s rows are computed using the same formula.) The Excel key file for this assignment may look like this:
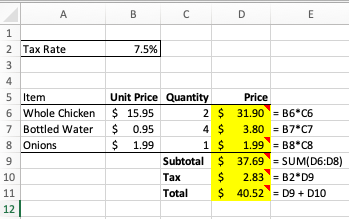
For convenience, column E shows the formulas entered in each row of column D for the highlighted cells. This is the correct solution, but it is just one correct solution. The rubric for each graded cell is specified as a cell note, added by right-clicking on the cell and selecting New Note from the cell dropdown menu: cells with these rubric notes are the ones with the little red earmarks at the top-right corner. If we hover on one of these cells, Excel will display the attached rubric note:
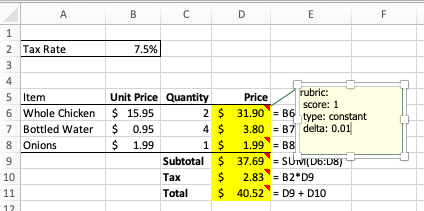
So cell D6’s rubric note contains this text:
rubric:
 score: 1
 type: constant
 delta: 0.01
This text is a rubric specified in PySheetGrader’s rubric language. The savvy reader will identify it as a YAML expression. YAML is a simple data serialization language in which specifications are structured using simple indentation. This specification tells PySheetGrader that cell D6 is graded as a straightforward value check (type: constant). To grade this cell, the grading engine first evaluates both the key cell and the corresponding submission cell to determine their computed values. The resulting values are then compared to set the cell’s score: if the values match, the cell gets the score indicated in the rubric (score: 1); otherwise, the cell’s score is set to 0. For numeric cells, a precision can be specified as well using the delta property, in which case the comparison is performed using the given precision.
This naive strategy works fine in some cases, but the real power of a spreadsheet comes from a cell’s ability to define a formula that refers to other cells. In the above example, cell D10’s rubric type is a formula as opposed to a constant (type: formula). The rubric note for this cell looks like this:
rubric:
 score: 3
 type: formula
This rubric note tells the grading engine that the cell is to be graded more smartly: as a formula. PySheetGrader compares the key cell’s formula to the corresponding submission cell’s formula to determine whether one formula can be mathematically reduced to the other by treating the cell references appearing in the formulas as free variables. If this is the case, the two formulas are mathematically equivalent, and the graded cell receives the score indicated in the rubric (score: 3); otherwise the cell’s score is set to 0. In this example, the key file specifies the formula B2*D9 for cell D10. Suppose the submission file’s D10 cell contains the formula D9*B2. The two formulas are mathematically equivalent, so the cell receives the score 3. There are infinitely many different ways to rewrite the formula B2*D9: PySheetGrader uses a symbolic math library SymPy to perform the comparison, and is smart enough to infer, for example, that the more complicated-looking formula 1 + SQRT(B2*B2)/(1/D9) - 1 is in fact equivalent to B2*D9.
The formula rubric type is important since it prevents a propagated mistake from being double-penalized. To see why, suppose the student made a mistake in cell D6 and receives a score of 0 for that cell. D10 depends on D9, which in turn depends on D6. If the rubrics for D10 and D9 were of type constant, both of these cells would also receive a score of 0 even if their formulas were correct, causing the submission to be penalized three times for the same early mistake.
PySheetGrader has several other rubric types and grading strategies that give the instructor further flexibility. We will get to them soon enough. But first let’s look at how the key file lets the grading engine know which cells needs to be graded and in what order.
Grading instructions: which cells to grade and in what order
We need a way to tell the grading engine how the grading should proceed to prevent PySheetGrader from checking every cell in a key file to figure out which ones have rubric notes attached and thus needs to be graded. We also do not want the cells to be graded in a random order or in an order contrary to the assignment’s expected workflow. This meta-information constitutes grading instructions. It is provided outside the cell-based rubrics in special spreadsheet tabs that must be added to the key file.
Since a spreadsheet can contain multiple tabs (sheets), first we need a way to tell the grading engine which tabs need to be processed and in which order. This information is included in a special tab named SheetGradingOrder in the key file. For an assignment with a single graded tab named Tab1, SheetGradingOrder simply looks like this:
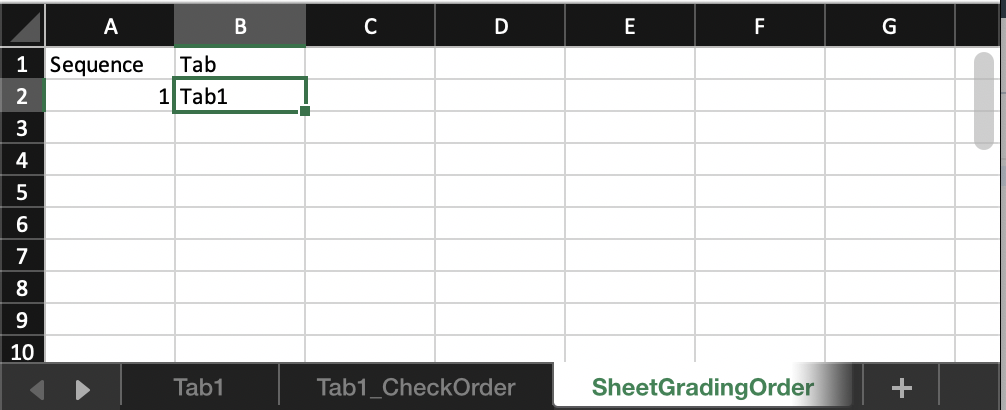
This tab tells the grading engine that the submission file should have a tab named Tab1, which needs to be graded first. That’s it! No other tab in the submission file needs grading in this example, so we have just one row for Tab1. PySheetGrader actually totally ignores SheetGradingOrder‘s first row that contains the column headings Sequence and Tab (they can be named any way the instructor likes). It also ignores the first column with the heading Sequence (the instructor may attach sequence numbers or internal identifiers to the tabs to improve readability, but doesn’t have to). The tabs specified in SheetGradingOrder‘s second column are processed in the order given, starting with the tab named in the second row. Multiple tabs, if needed, can be handled by adding extra rows to SheetGradingOrder.
Next we need a way to specify, for each graded tab, in what order the cells in that tab need to be graded. This instruction is given by adding a new tab to the key file for each tab in the submission file that needs grading. In this example, we have a single tab, Tab1, so we add a new special tab call3e Tab1_CheckOrder to the key file:
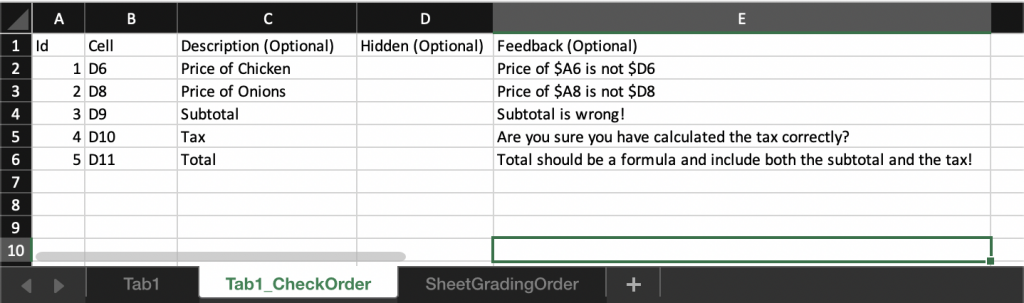
The prefix of the tab-specific tab’s name must match the tab for which it is specifying the grading instructions: TabToBeGraded_CheckOrder, where TabToBeGraded is replaced by Tab1 in this example.
As in SheetGradingOrder, the first row containing the column headings is ignored by the grading engine: this row is there just for informational purposes. The most important column is column B, titled Cell above: this column specifies which cells in the associated submission tab needs to be graded and in which order (from top to bottom). Each of these cells must have an attached rubric note in the corresponding key file tab. Column A (Id) specifies a unique identifier for each graded cell: these identifiers are used in the grade report. The remaining columns are optional and specify extra information and behavior that the instructor may want to add to the grading strategy of a cell:
- Column C: If a description is provided, it is printed in the grade report.
- Column E: If a feedback text is provided, the feedback text is added to the grade report if the cell receives a score of 0. The feedback text may refer to the submission file’s cell results using the $ prefix before a cell reference to further customize the feedback. In the above example, if the submission cell D6 of Tab1 receives a 0 score and the value of submission cell A6 and D6 equal Whole Chicken and 30.0, respectively, the feedback text for that cell in the grade report will read “The Price of Whole Chicken is not 30.0“.
- Column D: This is the hidden toggle, used for secretly graded cells. If the student should not know, for a graded cell, which cell is being graded in the grade report, the hidden toggle is set to H. If the cell receives a score of 0, the feedback is added to the graded report, but the cell reference and description are omitted. In the above example, none of the graded cells are hidden, so column D is empty. The hidden toggle is convenient for performing sanity checks: graded cells that students do not have to complete, but hold intermediate calculations or verify correctness conditions based on cells that the students have to complete. For example, a sanity check may stipulate that the computed probabilities in a table column must add to 1.
The grade report
To put all together, let’s have a look at the grade report for the above example. Suppose the student’s submission looks like this:
Column E is added to the submission file to show what the student entered in each highlighted cell. Note that the highlighted cells are the ones that will be graded. Notably, the student entered formulas in some cells, and hardcoded values in others. Depending on whether a cell is graded using the constant or formula rubric type, the student’s entry for that cell may be marked correct or incorrect.
PySheetGrader produces two reports in different formats: plain text and HTML. The plain text report is hard to read and is meant for archival and post-processing purposes, so we will only show the HTML version. The HTML grade report for this submission looks like this:
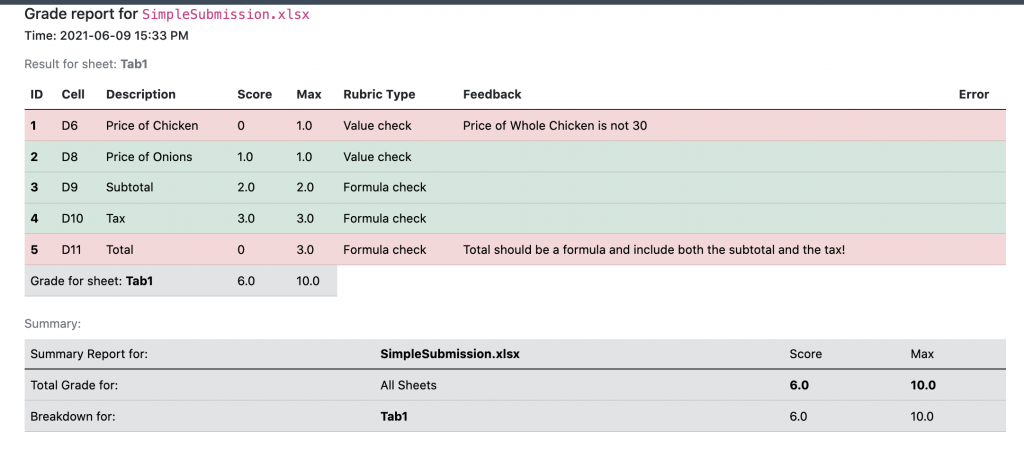
If you noticed that this report’s format looks somewhat familiar with its green (passing) and pink (failing) rows , the resemblance is not coincidental: it was inspired by the xUnit-class of software testing tools. Here the student made two mistakes: in cells D6 and D11. In cell D6, the student entered a hard-coded value, which is ok since since cell is graded using the constant rubric type (specified as Value check in the grade report), however the value was incorrect according to the key file (it should have been 31.9, but it was 30.0). In cell D11, the student entered another hardcoded value, 40.20. While the value is technically correct according the to the key file, the student should have entered a formula and computed this value from cells D10 and D9 instead. The student gets a score of 0 for both cells.
Let’s look at the grading of cell D9, which calculates a subtotal for the range D6:D8. The cell is to be graded as a formula. The formula specified in the key file is SUM(D6:D8), using Excel’s built-in function SUM. But the student entered the formula D6 + D7 + D8 instead in the submission file for this cell. The grading engine can recognize that the two expressions are equivalent, therefore the student receives the full score this cell.
The formula rubric type can handle most Excel built-in functions if the arguments are plain cell references as opposed to formulas themselves, but cannot handle arbitrary expressions involving arbitrary Excel built-in functions. Fortunately, the grading engine knows how to symbolically reason about some commonly-used built-in functions such as SUM, MIN, and MAX even when these functions’ arguments are formulas themselves. We are working on making other commonly used built-in functions to fully work with the formula rubric type.
Other rubric types
PySheetGrader currently provides a few other rubric types for increased flexibility. Here are some examples:
Soft Formula
The soft formula rubric type represents a compromise grading strategy between the formula and constant rubric types. It forces the student to enter a formula in a cell rather than a hard-coded value, but the grading engine performs a naive value comparison rather than a formula comparison. This rubric type is useful when a cell requires complex Excel built-in functions that the grading engine cannot interpret and the student is not allowed to enter a hard-coded value into the cell.
rubric:
 score: 1
 type: soft_formula
 delta: 0.01
The grading strategy for the soft_formula rubric type is as follows:
- If the cell does not contain a formula, the score is 0.
- If the cell contains a formula, the cell is graded as a constant rubric type by comparing the submission cell’s evaluated result to key cell’s evaluated result, ignoring any formulas.
The delta property is optional for specifying a precision.
Relative Grading
Relative grading allows a submission cell to be graded using the key cell’s formula and checking the result against the submission cell’s value. This strategy ensures the student’s solution is internally consistent in that it computes the result correctly using the right cell references, but doesn’t care how the student achieves this effect. Relative grading is useful when the same computation can be expressed in many different ways using different cell references. For example, suppose cell A1 depends on cell B1 and cell B1 depends on cells C1 and C2. Thus A1 = f(B1), and B1 = g(C1, C2). Therefore, in fact, A1 = f(g(C1, C2)), and we can also write A1 as a function of C1 and C2 rather than a function of B1. The formula rubric type will not work well in this example.
Relative grading has two variations via these the rubric types: relative and relative_f. For example:
rubric:
 score: 4
 type: relative
 delta: 0.01
The relative rubric type grades the submission cell by first evaluating the key cell’s formula using the submission file’s values referenced by the key cell’s formula. The result is then compared to the evaluated result of the submission cell. If they match, the cell receives the score assigned in the rubric; otherwise the cell receives a score of 0.
For example, suppose the key cell A1 contains the formula IF(A2 = "ok", B2, C2), which needs to be graded using relatively. In the submission file, suppose A1 evaluates to the value 13, A2 contains the string not_ok, B2 evaluates to the value 13, and C2 evaluates to the value 14. The instructor’s formula is evaluated with the student submission’s cells, which yields the result 14. This result is then compared with the value of the submission’s cell A1, which equals 13. In this case, the comparison fails since A1 equals 13, but its expected value is 14.
relative_fis simply a stricter version of therelativerubric type. The grading strategy is identical to that of therelativerubric type, but additionally the submission cell is required to be a formula (it cannot be a constant). If the evaluated cell is a hardcoded constant, the cell does not get a score.
Both relative and relative_f optionally admit a precision (via the delta property) when the result of the computation is numeric.
An example of the relative_f rubric type is shown below in a key file:
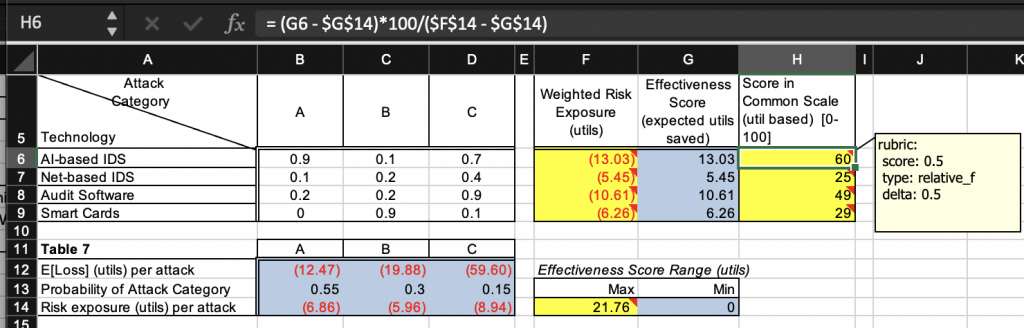
Here, cell H6 is computed from cells G6, G14 and F14 using the formula (G6 - G14)*100/(F14 - G14). This formula is evaluated on the submission file for the same cell: instead of the key file’s cells, the submission file’s cells G6, G14, and F14 are used in the evaluation. Even if the result does not match the value of cell H6 in the key file, as long as it matches (with a precision of 0.5) the value of cell H6 in the submission file itself and the submission cell computes this value using a formula of its choice, cell H6 is awarded to specified score of 0.5. The submission cell’s formula is not required to be equivalent to the key cell’s formula in this grading strategy.
Specifying alternative solutions for a cell
PySheetGrader allows multiple ways of satisfying a rubric type using alternative cells in the key file. These cells don’t have a rubric note of their own, but instead specify alternative ways in which the original submission cell can meet the rubric criteria. Alternative cells are added to a rubric note using the alt_cells property:
rubric:
score: 2
type: formula
alt_cells:
- A12
- A13
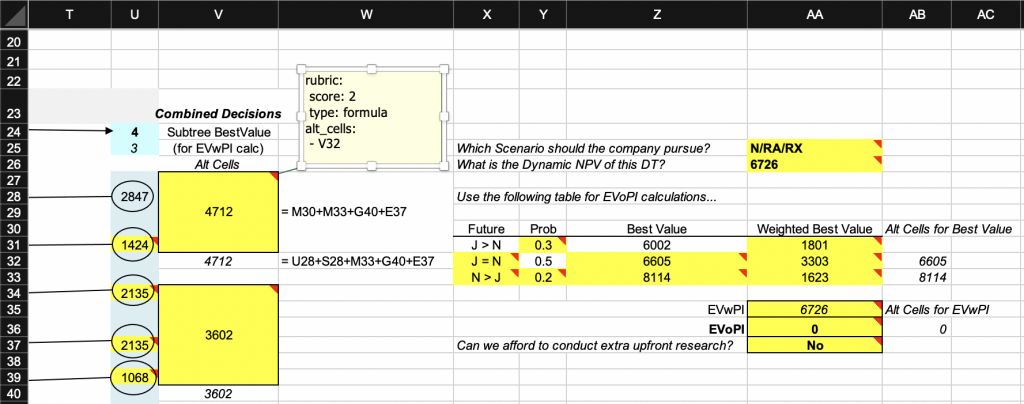
- A14Below is an excerpt from a key file with rubrics that take advantage of the alternative cells grading strategy. Merged cell V27 (merged with range V28:V31) has a formula rubric type (the formula is shown in column W). The rubric note defines cell V32 as an alternative cell, which contains an alternative formula for cell V27 (again, the formula is shown in column W). The alternative formula uses different cell references, but yields the same result. The grading engine first tries to grade the corresponding submission cell V27 using the original key formula, comparing the original key cell’s formula to the corresponding submission cell’s formula. If this strategy fails, the formula in the alternative cell is used and compared to the formula in the submission cell V27. If this second comparison succeeds, the cell V27 receives the specified score. If none of the original or alternative comparisons succeed, the cell receives a score of 0. Note that alternative cells in the key file are part of the grading specification: they should not be included in the starter template file deployed to the students: students should not, and do not need to, know about them.
The rubric types formula, constant, relative, relative_f, and soft_formula all admit the alt_cells property.
Specifying test cases for a cell
For numeric cells, another cell grading strategy available in PySheetGrader is inspired by unit testing in software development. This strategy treats a graded cell containing a formula as a unit to be tested. The unit behaves as a function, which can be tested by specifying an expected result when given a set of input values for the cells referenced by the formula. The input values are hypothetical values of the cells on which the submission cell depends in the submission file. The actual result is the (evaluated) value of the submission cell. The expected result is the (evaluated) value of the corresponding cell in the key file. The input values and the expected output value constitute a test case, which can be defined in new rubric type called test.
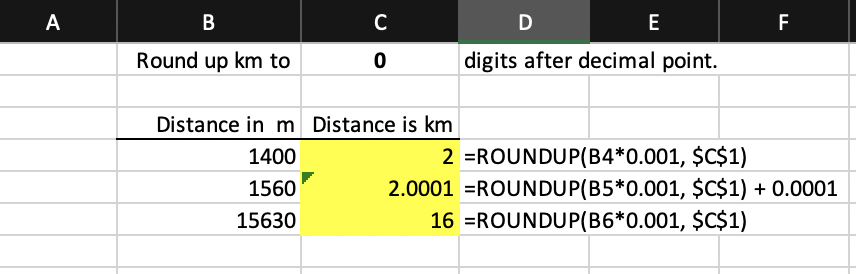
To illustrate, consider the simple case of a graded cell that converts a distance in meters to a distance in kilometers, rounding up the result to a specified number of digits after the decimal point. The solution (submission) uses Excel’s built-in function ROUNDUP(number, decimal_digits). In the submission file, the formulas entered in the highlighted cells are shown under column D. Note the deliberate mistake in cell C5.
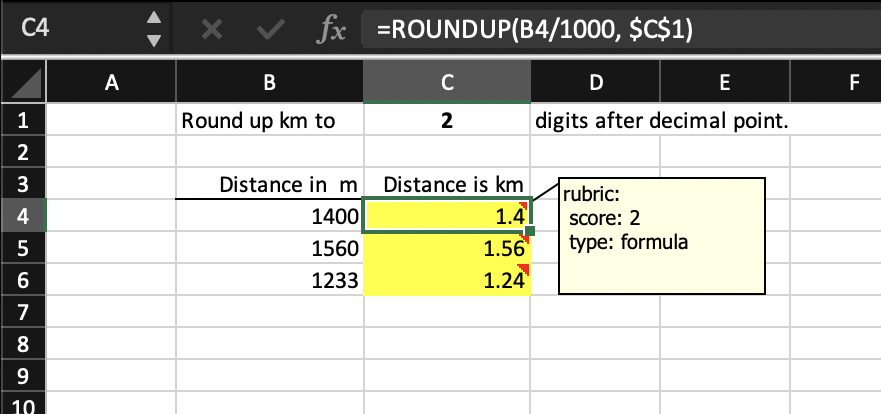
Suppose the key file for this problem looks like below. Cell C4 is graded as a formula, specified as ROUNDUP(B4/1000, $C$1). Unfortunately, the grading engine cannot reduce this formula to the submission cell’s formula even though they are mathematically equivalent: it does not attempt to interpret a built-in function’s arguments if the arguments themselves are formulas (rather than constants or plain cell references). As a result, PySheetGrader will fail to grade cell C4 as correct.
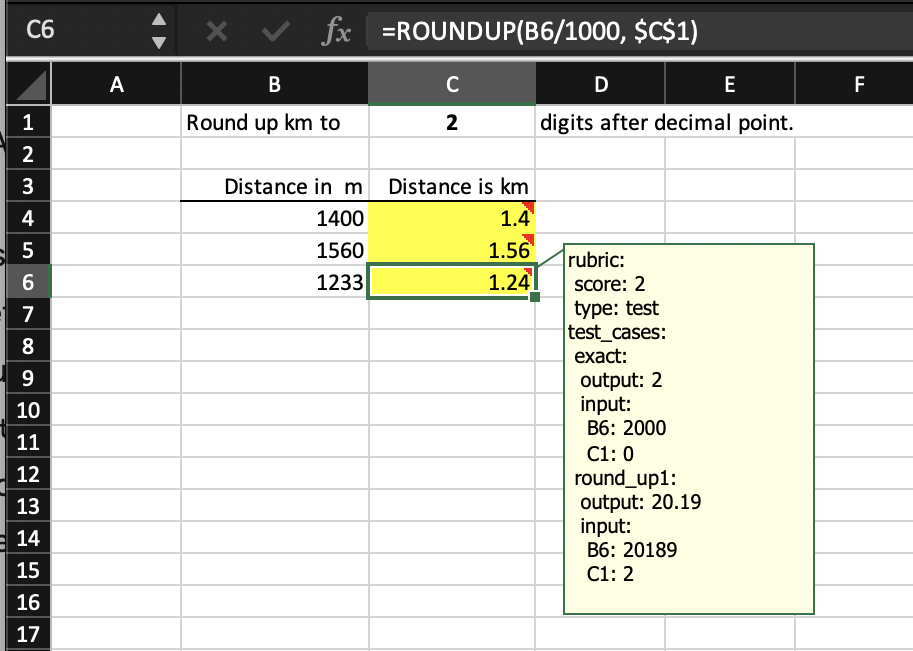
To get around this problem, an alternative strategy is to use the test rubric type, as shown in key cell C5’s rubric note below. Note that the key cell C5 has exactly the same formula as the key cell C4. Fortunately, PySheetGrader knows how to evaluate the built-in ROUNDUP function because this function is explicitly implemented by the grading engine along with some other commonly used Excel built-in functions.
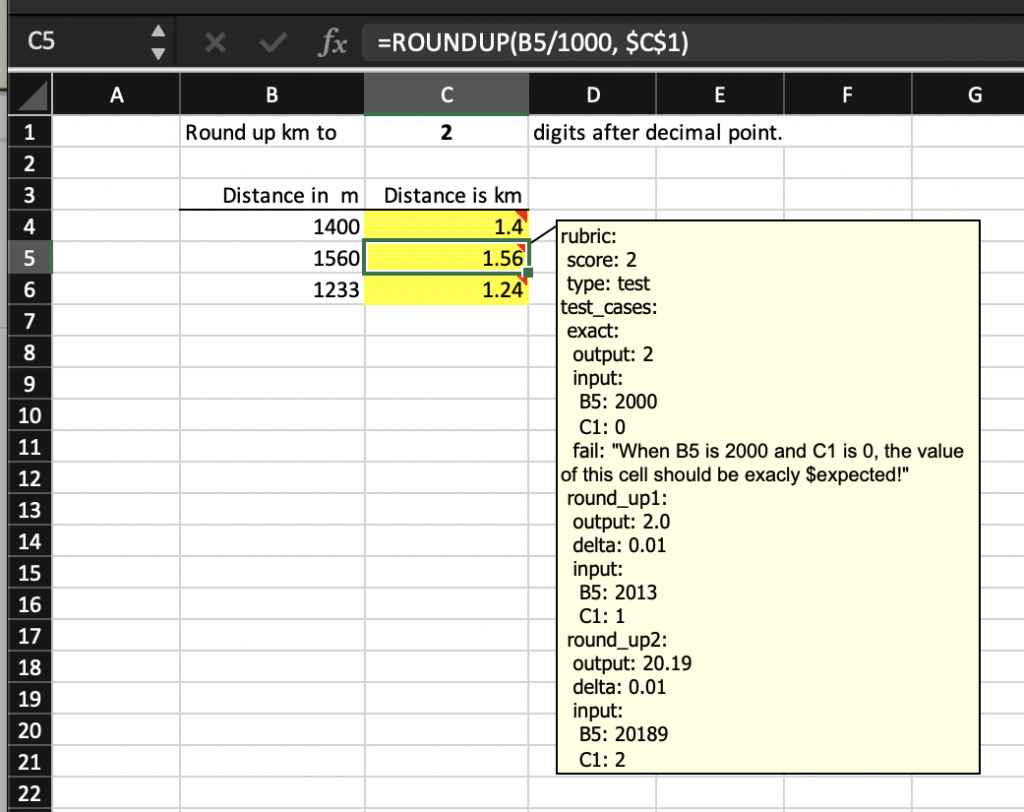
Let’s repeat C5’s rubric note before dissecting it:
rubric:
 score: 2
 type: test
test_cases:
 exact:
  output: 2
  input:
   B5: 2000
   C1: 0
  fail: "When B5 is 2000 and C1 is 0, the value of this cell should be exactly $expected!"
 round_up1:
  output: 2.0
  delta: 0.01
  input:
   B5: 2013
   C1: 1
 round_up2:
  output: 20.19
  delta: 0.01
  input:
   B5: 20189
   C1: 2
The above rubric note specifies three test cases, called exact, round_up1, and round_up2, for cell C5. This is done using the test_cases property. Each test case must be named uniquely. The first test case, exact, states that when the submission cells B5 and C1 (listed under property input) evaluate to values 2000 and 0, respectively, the submission cell C5 (property output) should evaluate to a value of 2. Here, the given output value of 2 is the expected result of the test case. The grading engine evaluates the formula of the submission cell C5 with the given inputs instead of the actual cell contents entered in the submission file. If the result matches the expected result, the test case passes; otherwise, it fails.
Each test case may also have these optional properties:
- delta: for specifying a precision for numeric cells, and
- fail: a failure message (defined as a double-quoted string) to be included in the grade report when the test case fails.
The test cases round_up1 and round_up2 in the above rubric uses the delta property. The test case exact defines a failure message using the fail property.
The failure message can reference the submission file’s cells using $ variables just like what we can do in the _CheckOrder tab; e.g., in a failure message string, $B5 would refer to the actual (evaluated) value of the submission cell B5 on the graded tab. In addition, PySheetGrader defines two reserved variables , $expected and $actual, that can be used in failure messages. These variables evaluate to the actual and expected values of the graded cell, respectively.
The test rubric type uses an all-or-none strategy for scoring the cell. A graded cell receives the score assigned to it only if all of the test cases in the test rubric note passes. Otherwise, the cell receives a score of 0. In the above example, cell C5 will receive a score of 0 because two out of its three test cases fail. (In the future, we are planning to add a partial credit version of this rubric type that pro-rates the score according to the proportion of the passing test cases.)
Here is a variation of the test rubric type for cell C6 in which all test cases pass for the original submission file.
The grading report for the associated tab looks like the following for cells C4, C5, and C6.
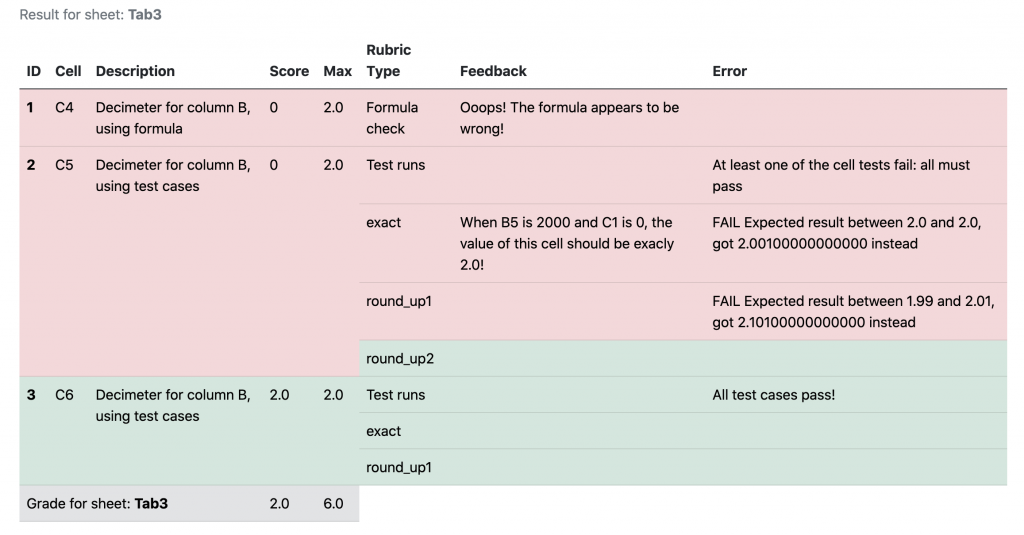
C4 and C5 receive a score of 0 each. For cell C4, the formula comparison fails because PySheetGrader cannot cope with formulas within the arguments of an Excel built-in function even if the grading engine knows how to evaluate the built-in function: therefore the formula rubric type is unsuitable for cell C4. C5 gets a score of 0 since at least one test case is failing. The test case exact fails because of a (deliberate) mistake in the corresponding submission cell formula. The test case round_up1 fails because the test case is incorrectly specified (the expected value is wrong in the output property). Finally cell C6 gets a full score of 2 because both of its test cases pass.
A word of caution: indentation is significant in a YAML specification, and since rubric notes are YAML specifications, one must pay attention to correct indentation in complex rubrics. The test rubric type is especially prone to indentation mistakes.
Two additional points on the test rubric type: it cannot have an alt_cells property, and it is currently only available only for numeric cells.
Multi-tab spreadsheets and specifying minimum work requirements
Complex spreadsheet assignments often require multiple tabs (sheets). When this happens, each tab is graded separately and in a self-contained manner. To be graded by PySheetGrader, a cell on a graded tab must refer only to cells on the same tab. The SheetGradingOrder tab specifies the order in which the different tabs should be graded, and each graded tab must in turn have its own _CheckOrder tab that provides specific grading instructions for that tab.
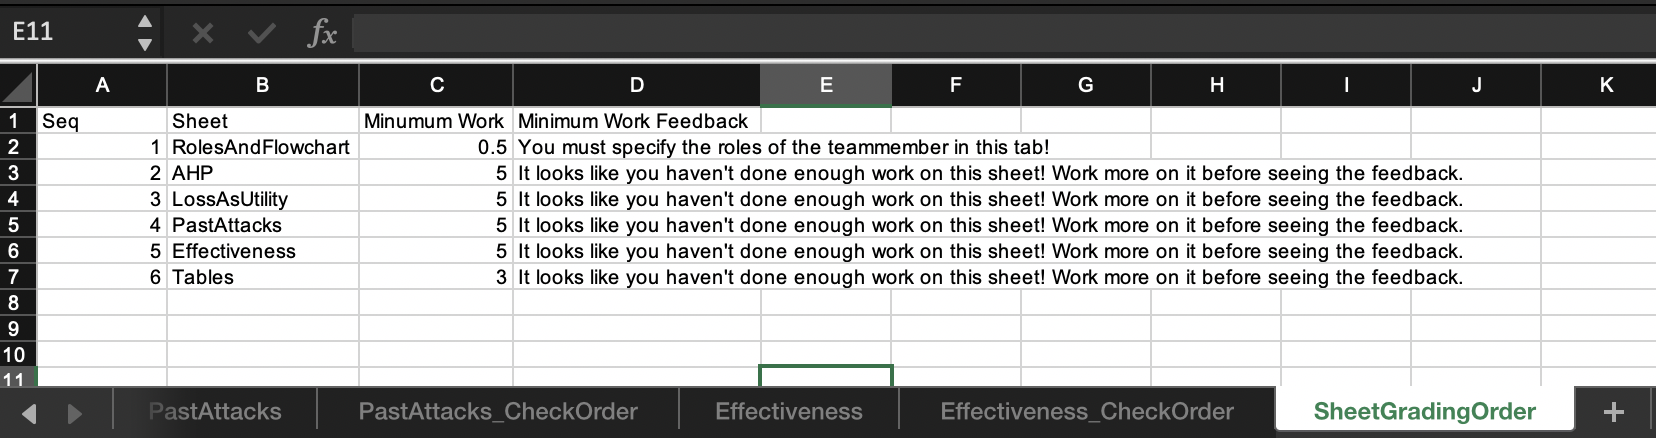
SheetGradingOrder can can optionally specify extra settings related to a graded tab. One of these settings is minimum work requirement, which tells the grading engine to suppress all feedback associated with that tab in the grading report if the tab receives a total score below a specified minimum for that tab. The minimum work requirement prevents students from relying on excessive experimentation. If the minimum work requirement is not met, the grading report can include a custom message if a feedback message specified for that tab. An example is shown below.
Vocareum
PySheetGrader can run on as a standalone on a local machine and batch-process collected submissions using simple scripts. However, its real power comes through when integrated into a cloud-based submission management platform. My choice is Vocareum, which I have been using successfully since 2015 to automate unit testing and model checking assignments. PySheetGrader is easy to setup on Vocareum, which can further integrate with popular LMS systems. Vocareum setup instructions and scripts are available upon request.
How does auto-grading affect student performance?
I deployed PySheetGrader on Vocareum for the first time in the Spring 2021 offering of my course. The data underlying my spreadsheet assignments and labs change from semester to semester. There also are variability points whose contents I switch for differentiation and components that I turn on and off to create multiple versions. But essentially, the assignments and labs structurally remain the same for valid comparison between different offerings.
I compared the performance of the 2021 cohort to that of the 2020, 2019, and 2018 cohorts for five assignments and three labs. Assignments and labs were manually graded from 2018 through 2020. The main differences between an assignment and a lab are that (1) labs are performed live in class (remotely during a live session or in-person inside the classroom) whereas assignments are take-home; and (2) lab are guided by the instructor with synchronized steps and sharing of intermediate results whereas assignments are not due to their offline nature. The 2020 and 2021 offerings of the class were completely remote, whereas the 2018 and 2019 offerings were in person. Other than the delivery mode, there were no notable differences among the different offerings. The table below compares student performance in the 2021 offering to student performance in the previous offerings.
| 2021 | Pre-2021 | |
| Total no. of students | 35 | 64 |
| Total no. of assignments graded | 163 | 313 |
| Total no. of labs graded | 93 | 189 |
| Average grade for assignments | 96.80% | 92.74% |
| Average grade for labs | 98.81% | 99.07% |
| % Improvement for assignments from Pre-2021 to 2021 | 4.38% | |
| % Improvement for labs from Pre-2021 to 2021 | -0.27% | |
| p-value (significance) for improvement in assignment performance | < 0.00000001 | |
| p-value (significance) for improvement in lab performance | 0.499 |
The nature of the labs ensures that most students get full marks: the tasks are guided, and students complete the steps in a lock-step manner and check their results. Non surprisingly, there was no significant difference in the lab grades. Students’ performance in take-home assignments however improved on average by 4.38%, which was highly statistically significant. I attribute this improvement to the ability to give fast and granular feedback to students with multiple chances to correct their mistakes, which is not feasible or scalable without automated grading. While the 4.38% improvement seems small, it is large enough to push a student to the next letter grade in their final assessment.
Future plans
PySheetGrader is written in Python. It is still under development: we are constantly improving it, addressing glitches, and adding new capabilities. Our philosophy is to maintain backward compatibility when we introduce new features. Some of the planning capabilities include:
- new and more advanced rubric types for maximum flexibility,
- negative grading rubrics,
- killer cells to specify fatal mistakes,
- ability to embed Python code (assertions) into rubrics for Python-savvy instructors and advanced assignments,
- better feedback mechanisms for students,
- a professional-grade testing process for making changes and adding new features,
- better error reporting for instructors, and
- plagiarism deterrence capabilities.
If you are interested…
If you are interested in giving PySheetGrader a try as a beta user, please ping me.
Related posts
Testing PySheetGrader and its Assignments
Acknowledgements
Many thanks to several CMU students who have been contributing to the development of PySheetGrader. Ricardo Suranta helped me devise the original concepts, created a proper software architecture for the codebase which has served us very well, implemented the base capabilities of PySheetGrader in a fully functional prototype, and built its initial release to be used with Vocareum as part of his graduate research project. Prerna Singh and Fang Han, my former TAs, managed PySheetGrader’s first deployment in a live course while implementing the necessary patches and planned improvements on the fly. The improvements included a JUnit-style HTML report, refactoring of the Vocareum scripts, relative and soft formula rubric types, customized feedback messages to test cases in the test rubric type, the minimum work requirement setting, and the hidden grading setting. They performed all of this in an incremental manner, deploying new features and patches at every assignment. Ksheeraja Raghavan implemented the long-awaited negative grading strategy and fixed some obscure bugs. Sandeep Keshavegowda worked on a new rubric type for performing straightforward sanity checks as an alternative to the test rubric type and implementing grading instructions to specify showstopper mistakes and cell-grading prerequisites.
 I was asked to share some of the pedagogical innovations from two books I recommended once during a talk: Pedagogical Patterns and Training from the Back of the Room. In this post I will focus on Pedagogical Patterns, and leave Training from the Back of the Room for my next post. I will provide an overview of the book and share the insights that I have put in practice. I hope you will be tempted to read them and apply some of these ideas.